This article is published in the Case Study category.
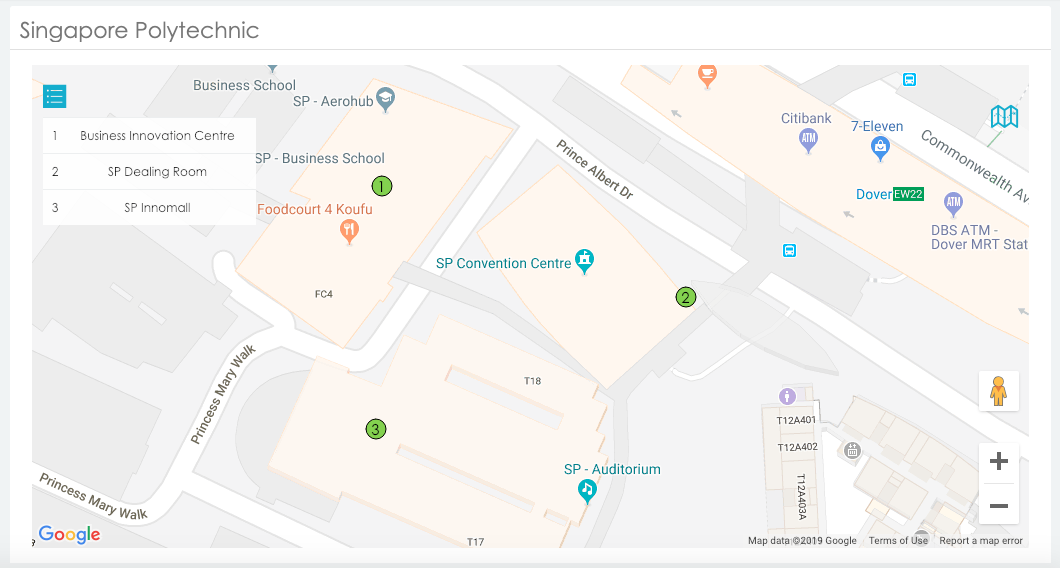
In the beginning of January, Singapore Polytechnic organised its yearly Open House event introducing the educational institution’s many subjects to new-coming students, willing to find help and inspiration before choosing courses that will influence their future career choices. During the three days of the event, from January 10 to 12, 2019, LBASense detectors were deployed onsite to offer unique insights into the crowd’s distribution and activity.
With classes, among many others, on cybersecurity, robotics, engineering, business or chemical and life sciences, Singapore Polytechnic offers plenty of options. Indeed, figuring out what choices to make for the future can be a difficult moment for undergraduates, as illustrated by students themselves in this video from Singapore Polytechnic.
In addition to meeting students and learning about the different class options, visitors could also discover the incredible work led by Singapore Polytechnic students such as the solar car or the automatic pharmaceutical bottle dispensing system, both built in the School, which probably contributed to the success of the event.
As innovation and technology work hand in hand with business intelligence, DFRC initiated a partnership with the School of Business to monitor and analyse the results of this event.

Indeed, the challenge during the Open House event was to analyse how the crowd was globally distributed among the different presentation booths’ areas, while also understanding the number of unique visitors in different areas.
To lead this analysis, three LBASense sensors were deployed onsite, allowing to detect mobile phones in a passive and anonymous way, during the event’s three days. To fine-tune these results, the LBASense system removed visitors detected for less than 5 minutes (passers-by) and those detected for over 4 hours (such as exhibitors).

As shown in the above picture, the Open House’s most popular day was the first day, January 10th, and the most frequented zone was the “SP Innomall” zone, that attracted up to 906 visitors, from 16:00 to 17:00, on January 10.
.
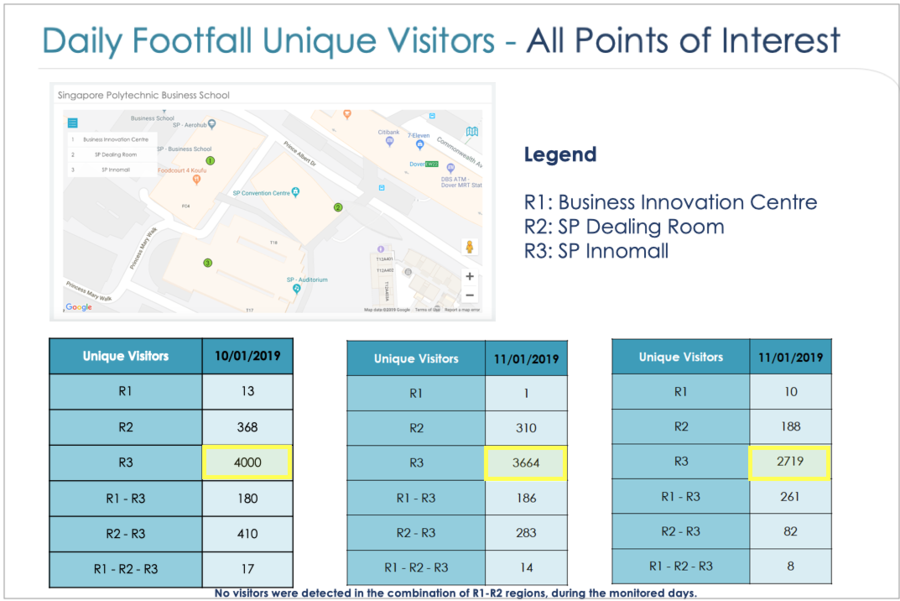
Thanks to the capability to determine unique visitors’ behaviour, LBASense Unique Visitors module offers insights related to visitors’ movements and visit choices in a venue, as shown in picture below.

Indeed, results still show, as in Figure 2, that the Region 3 (R3, called “SP Innomall”) was the most popular area with the highest number of unique detections. But these results also show that many visitors decided to stay in this particular region only, as only a few of them were detected in other regions too.
.
Interested in analysing visitors’ behaviour at your event? Discover LBASense for events or contact us for a tailored scenario.

Data team
Copyright © 2022 DFRC
43 Science Park Road #01-11 Rm 8, Singapore 117408